The standard S&P 500 gives more weight to companies with larger float-adjusted market values. Owning exposure to 500 companies therefore does not mean that each has an equal effect on the result. Diversification deserves a review of weights, overlapping holdings, and common economic risks—not just a count of names.
A market headline can feel disconnected from an investor’s experience. The index may look resilient while many holdings struggle. That does not necessarily mean the index is wrong or the portfolio is broken. They may be measuring materially different combinations of investments.
The useful question is what sits beneath the headline. How much influence do the largest companies have? How widely are gains shared? And how closely does the household’s actual mix resemble the index being discussed? Those questions help frame a review without predicting which approach will lead next.
Understand what the S&P 500 measures
S&P Dow Jones Indices describes the S&P 500 as a measure of large-cap U.S. equities. Its methodology uses float-adjusted market capitalization: market value adjusted for shares available to public investors. Larger eligible companies generally carry more weight than smaller constituents.
Membership also follows eligibility and committee rules. The index is not simply an automatic ranking of the largest listed companies. Financial viability, liquidity, and other requirements are part of its construction. Its role is to represent a particular market segment, not an individual household’s complete investment plan.
This distinction makes the phrase “concentrated by design” worth refining. Capitalization weighting is the design choice. The amount of concentration is an outcome of that method and the relative market values of the companies included. The method does not target a fixed percentage for the ten largest names.
Count dollars as well as companies
An index may contain many companies while a relatively small group accounts for a large share of its weight. In its September 30, 2026 due diligence report, Helios placed the ten largest names at roughly 40% of the S&P 500. That is a dated, rounded observation from the report, not a current allocation figure.
Hypothetical illustration, not an actual index or client portfolio: Imagine $100,000 distributed across 500 companies, with 40% allocated collectively to ten of them. Those ten companies account for $40,000. The other 490 share $60,000. This example assumes no particular weight for any single company and no investment return.
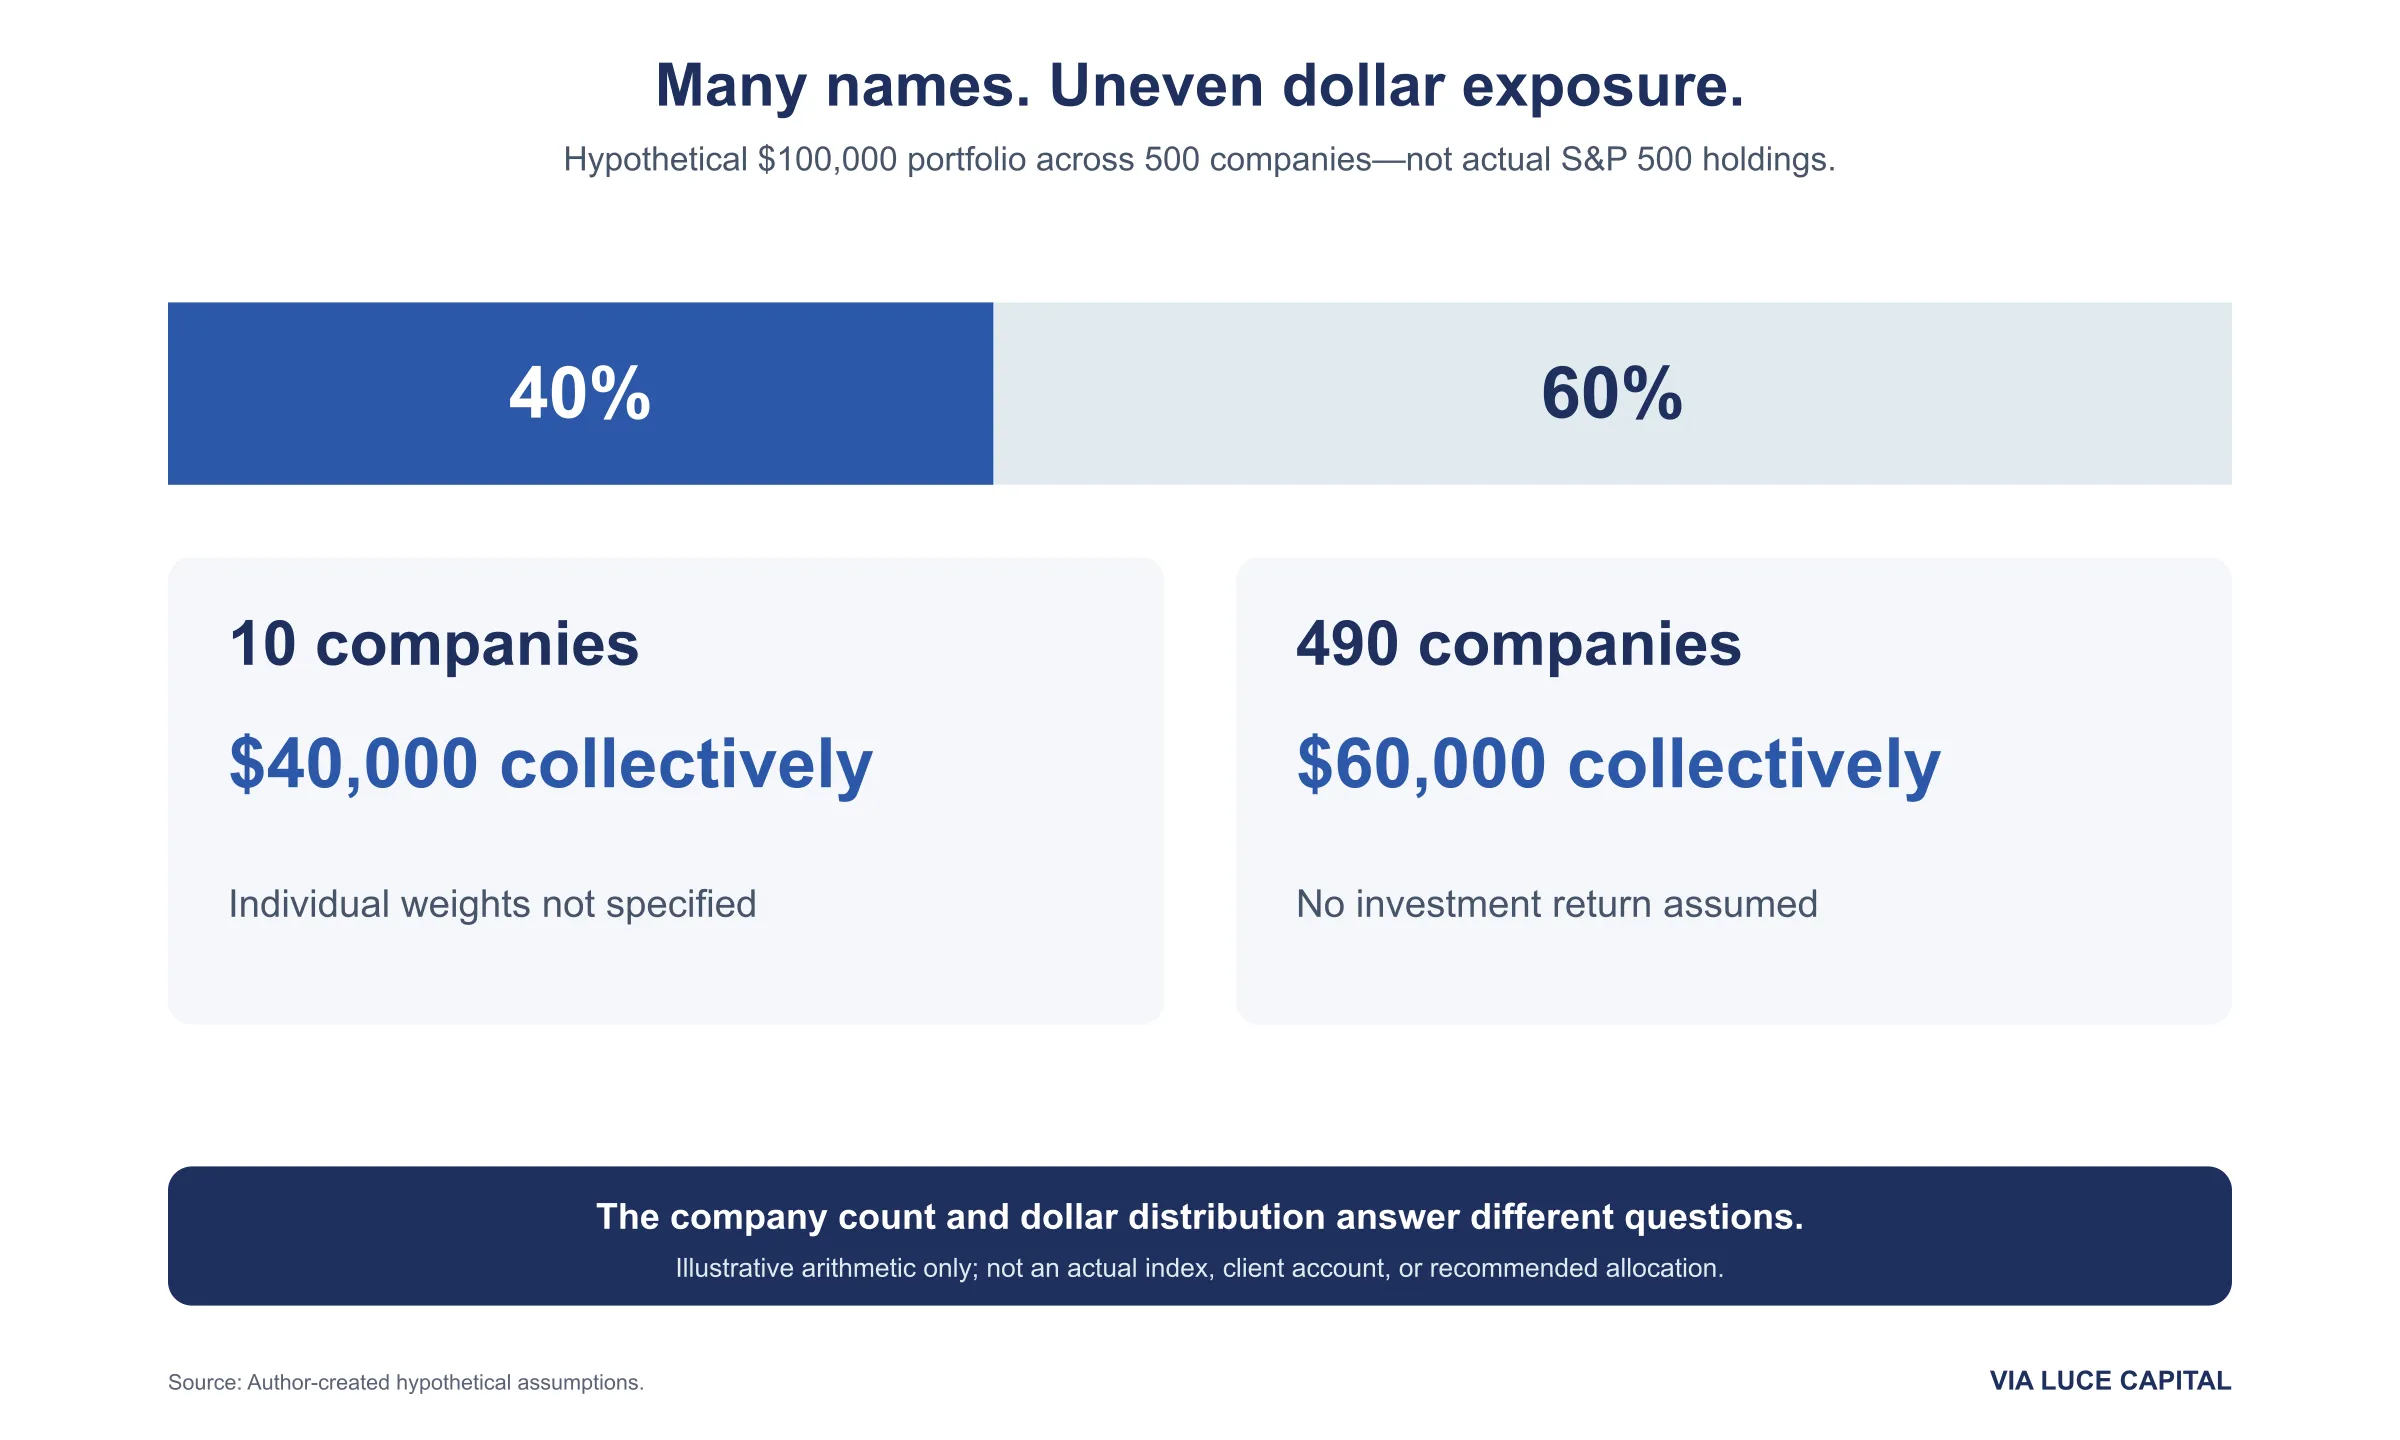
The company count sounds broad. The dollar distribution reveals a different kind of dependency. Both statements can be true at once. That is why a holdings list alone does not tell you how strongly a small group can influence the overall experience.
Separate participation from volatility
Breadth describes participation, such as how many stocks advance or trade above a moving average. Dispersion describes how widely individual returns differ. Volatility concerns the magnitude of fluctuations. An index’s return is yet another measurement. None of these is interchangeable with the others.
Opposing movements can partly offset inside a weighted index. A relatively quiet headline can coexist with substantial differences among its constituents. Concentration can also give a few large companies considerable influence even when participation is weak. The resulting experience depends on both weights and how holdings move together.
The dated evidence is instructive. Helios described narrowing participation in September. Cboe’s October 12 commentary separately reported increasing dispersion even as broad implied volatility eased. These observations support looking below the index level. They do not establish that every market segment was weakening, that all volatility measures were rising, or that a decline had become inevitable.
Look through funds across the whole household
Owning several funds does not necessarily create several independent exposures. A broad U.S. fund, a growth-oriented fund, and a sector fund may overlap substantially. Add directly held shares or employer stock, and the household can have more dependence on the same businesses than the account labels suggest.
Start with the underlying holdings and combine exposures across accounts. Then consider common drivers: interest-rate sensitivity, industry demand, geography, and business conditions. Different company names can still respond to the same forces. Conversely, different asset labels do not prove that two holdings behave independently.
For a household with employer equity, the review extends beyond investments. Salary, bonuses, future vesting, and career prospects may already depend on the employer or its industry. That connection belongs in the discussion even though future compensation does not appear as a current portfolio holding.
Equal weighting changes the question
The S&P 500 Equal Weight Index uses the same companies but assigns equal company weights at its quarterly rebalances. Between those dates, price movement causes weights to drift. This gives a different view of participation from the capitalization-weighted index.
Equal weighting is not a free improvement. It changes company and sector exposures, gives relatively more influence to smaller constituents, and requires rebalancing. A product following it can involve turnover, expenses, and tax considerations. It may trail the standard index for long periods when the largest companies lead.
Similarly, adding international stocks, smaller-company stocks, bonds, or other exposures introduces different risks and potential sources of return. The objective should be a mix appropriate to the household, rather than a collection assembled solely because its recent results differ from the S&P 500.
Choose the comparison before judging the result
A household portfolio may fund near-term spending, hold reserves, or follow a specific risk mandate. Comparing that entire mix with an all-equity large-company index requires explanation. The comparison can be informative, but it does not erase those differences in purpose and exposure.
Agree on what is being evaluated: the equity component, the whole portfolio, implementation costs, or progress toward a planning goal. Use the same dates and distinguish price returns from total returns when reviewing data. Avoid changing the comparison simply because another benchmark now looks more flattering.
Concentration is a reason to examine a dependency, not an automatic sell signal. A change may create taxes, costs, and a new set of exposures. The review should identify the concern, the available alternatives, and the trade-offs before translating the observation into a transaction.
Prepare a look-through review
Ask for a look-through summary that uses the same valuation date across the accounts. Record the largest underlying company exposures, the sectors represented, and any substantial position whose value is already tied to compensation or a future expense. An account-by-account summary may miss the combined dependency.
Then distinguish an intentional concentration from an unnoticed overlap. A holding may have a specific role, significant tax consequences, or sale restrictions. Identifying it does not decide what to do next. It creates a more useful discussion about whether the exposure is acceptable, what alternatives exist, and how any change would be implemented.
Sources
- The S&P 500 measures large-cap U.S. equities and uses float-adjusted market capitalization. Eligibility includes liquidity and financial viability; it is not simply an automatic list of the largest stocks. — S&P Dow Jones Indices, S&P U.S. Indices Methodology, July 2026, pp. 4 and 7–12; reviewed October 17, 2026.
- The equal-weight version uses the same companies with equal company weights at quarterly rebalances; weights subsequently drift. — S&P Dow Jones Indices, S&P 500 Equal Weight Index overview; reviewed October 17, 2026.
- The September 30 report describes weak underlying participation and places the ten largest names at approximately 40% of the index. This is a dated, rounded report observation. — Helios Quantitative Research, September 30, 2026 Due Diligence Report, pp. 12–13; advisor research material supplied for this review; reviewed October 17, 2026.
- The October 12 commentary reports increasing dispersion while broad implied volatility eased; that distinction does not establish a future market direction. — Cboe, Volatilities Fall on Oil/Yield Reprieve as the S&P Rallies Into Earnings Season, October 12, 2026; reviewed October 17, 2026.
- Fund holdings can overlap with other funds and direct holdings; concentration can arise through correlated exposures or employer stock. — FINRA, Concentration Risk; reviewed October 17, 2026.
- Allocation, diversification, and rebalancing involve household goals, risk tolerance, taxes, and costs. — U.S. Securities and Exchange Commission, Asset Allocation and Diversification; reviewed October 17, 2026.
- Hypothetical weight arithmetic only: $100,000 × 40% = $40,000 across 10 companies; the remaining $60,000 spans 490 companies. No particular company weight or return is assumed. — Via Luce Capital, author-created illustration; reviewed October 17, 2026.